Award Winning Stock Picking Software
You Don't Need to be an Expert to Invest Like One


Your personal AI Financial Coach

Personalized Financial Guidance | |
- Custom Recommendations: Based on your risk tolerance, portfolio performance, and watchlist preferences, I offer personalized stock recommendations that align with your investment goals. | |
- Dynamic Insights: I provide detailed, nuanced, and long narrative descriptions that encompass financial, technical, earnings, growth, and risk information. |
Enhanced Portfolio Management | |
- Analysis and Suggestions: I analyze your portfolio data and suggest potential adjustments to optimize returns while considering your specific risk acceptance score. | |
- Risk Assessment: I accurately assess the risk level of your holdings using a five-point Risk Number system and provide actionable insights based on this assessment. |
Strategic Investment Advice | |
- Concentrated Portfolio Strategy: I advocate for a concentrated portfolio strategy, targeting high-potential stocks rather than broad diversification. This approach helps to maximize growth opportunities within specific sectors. | |
- Industry and Sector Insights: I give detailed performance narratives and highlight trends across different industries and sectors to aid in sector-specific investing. |
Educational Support | |
- Verbose Explanations: I offer detailed explanations and insights for novice investors to understand complex financial jargon and market dynamics. | |
- Investment Strategies: Learn various investment strategies and understand their implications directly from my analysis and recommendations. |
Build Your Stock Portfolio in 3 Easy Steps!

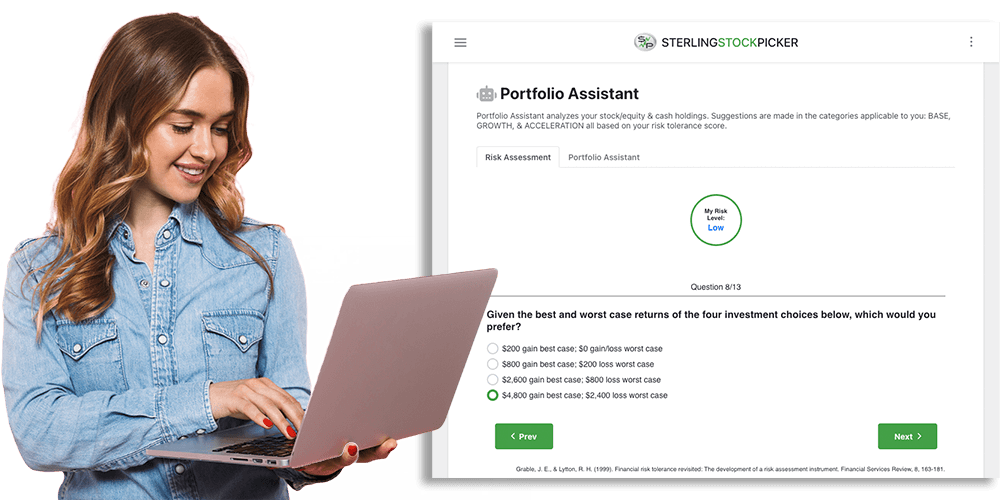
Discover Your Risk Tolerance
5 Minute Questionnaire to Easily Discover Your Ability to Handle Risk.

Search Stocks Aligned With Your Personal Values
Easy, Stock Picking Interface to Find Winning Stocks Confidently.

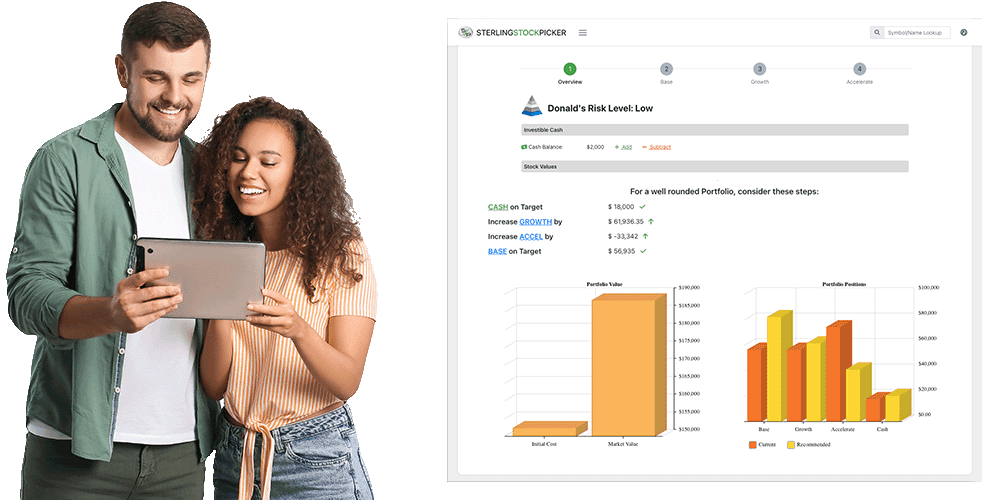
Build Your Portfolio
Done-For-You Portfolio Builder, Takes the Guess Work out of Investing!


The latest Intel to make the best investment decisions
- Northstar Guidance Rating & Recommendations
- Continuous Updates From Insider Transactions
- Social Sentiment Analysis: Positive and Negative trends
- Analyst Ratings and Price Targets for Top Rated Stocks
- Latest & Most Important Daily Stock News & Videos
Search Stocks Aligned With Your Personal Values |
The Pick Stocks section of Sterling Stock Picker is your personalized stock screener, designed to help you quickly find high-potential investments that align with your unique goals, risk level, and personal values. With powerful filters at your fingertips, you can search by sector, industry, dividend preferences, risk category, market cap, region, implied volatility, and even personal alignment settings like value-based investing.
Whether you're looking for top-rated Northstar stocks, high-growth opportunities, or stable dividend payers, our screener makes it simple. Skip the noise and zero in on the stocks that matter to you. It's intuitive, beginner-friendly, and deeply powerful for more advanced users—so no matter where you are in your investing journey, Sterling Stock Picker helps you make smarter, faster decisions.


Our Software Shows you Winning Stocks in 2 Clicks
Industry Best
Stock Rockets
Top Rated
30 Day Best
Success Recipes
Investment Guidance
Stock Forum
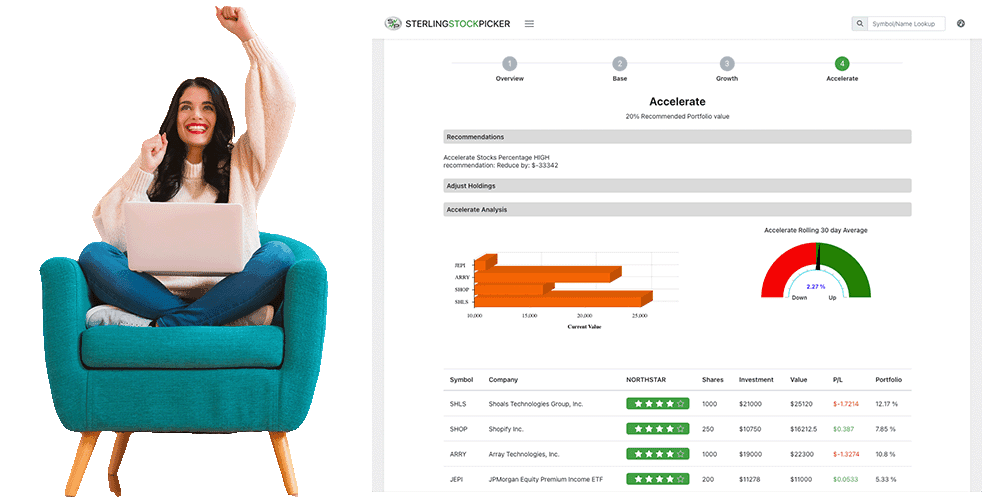
Done-For-You Portfolio Builder
- Easy 13 Question - Multiple Choice Survey
- Determines Your Risk Tolerance Level for Investing
- Integrates Directly With Portfolio Builder and Shows You the Best Rated Stocks for Your Risk Level
- Risk Level Shown for all Stocks - to Allow you to Align Your Risk Tolerance With Your selected Stocks

Save 30% with Annual Billing
Stock Analysis Based on Fundamental, Financial and Technical Metrics
Curated Data Base of 60,000 + Stocks & Crypto
Real Time Stock Quotes
Crypto Analysis Based on Technical Indicators
Comprehensive Stock Search Based on Your Risk Tolerance Level
Stock Search Aligned With Your Personal Values
Access to Weekly Market live streams
Buy/Sell Stock Recommendations via Email or Text
Customized Portfolio Recommendations
Finley AI: Your Personal On-Demand Fiancial Coach
Customized Real Time Streaming Ticker
Stock Rockets, Access to Stocks with 50% + Earnings Growth, Industry Top Performer & 5-Star North Star Ranking
Community Chat Forum & Recommendations: Most Watched & Community Best Performers
Stock Price Target Notifications via Email/Text or Both
Customized Portfolio, Watchlist, Dashboard & News Feed
Track Stock Performance
Access to SSP Top Investors
What our clients say about us
SaaS Awards Winner
We at SaaS Awards recommend Sterling Stock Picker due to its impressive results, which are outperforming the market averages. Well done, Sterling Stock Picker

Christopher Southall
Lead Judge-SaaS Award
200% return on my investments
I have been using the Sterling Stock Picker for almost a year and it has played an integral part in me achieving over a 200% return on my investments. Do your Due Diligence with the help of this amazing program.

Chris Johnson
SSP Valued Member
I gained 32%
This is my first year investing, and thanks to all your help from the App and your Live calls each week, I gained 32%. Thank you so very much for sharing your knowledge through the App, for people like me !

Jade Fulton
SSP Valued Member
This app has changed by life!
I love the Stock Rockets! I use this section regularly in the STERLING STOCK PICKER app! This app has changed by life!

Sheena Denscombe
SSP Valued Membe
Thank you SSP!
I love that I receive recommendations in my email inbox for me, tailored and customized for my own values and beliefs. Thank you SSP!

Julie Rose
SSP Valued Member
Learn More - with PRO$PER™
A Financial Success System by Sterling Stock Picker


Financial Knowledge Changes Everything
Welcome to PRO$PER™ . The Proven Financial Success System to help you achieve your financial goals. We give you all the tools and knowledge for you to overcome money blocks, create an abundant Money-Mindset, reduce money stress, and build an investment portfolio!Experience a holistic approach to money - Get, Keep, and Grow Money. Cultivate mindfulness to alleviate financial stress and reduce debt for a secure future.
Transform your mental relationship with money through powerful insights and practical strategies. Start your journey to financial well-being and abundance.
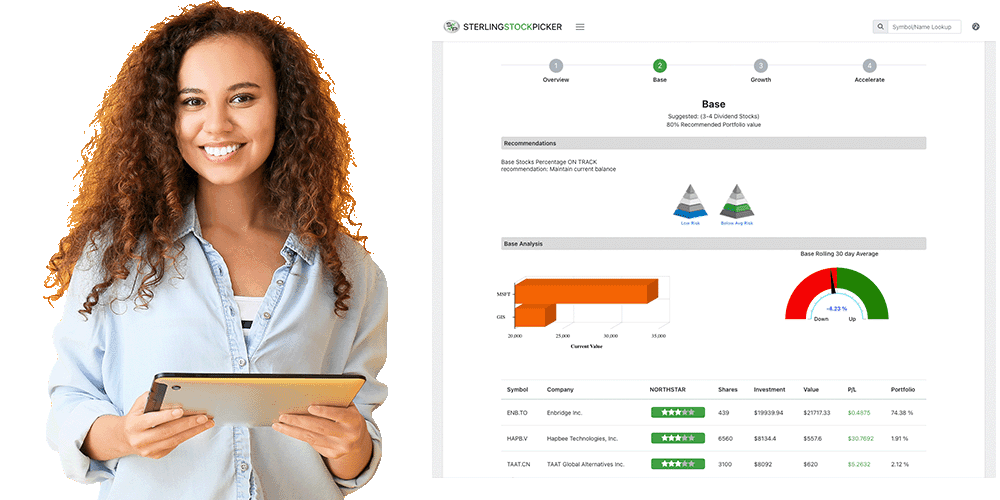
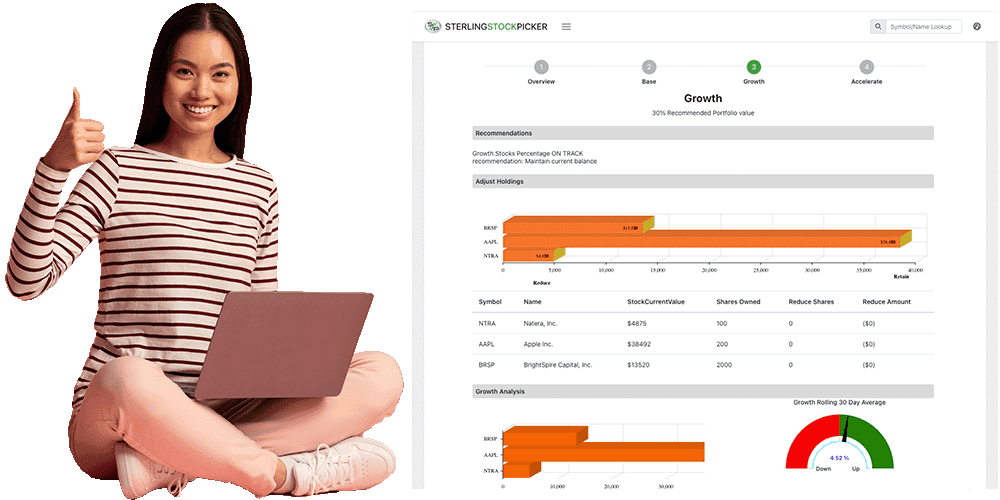
Implement our proven Base, Growth, and Accelerate Portfolio strategy to build a resilient and solid investment portfolio. Master the art of investing in stocks and maximize portfolio returns with Options trading.